Spot a destabilising placement two weeks before the breakdown.
Continuous 9-dimension scoring across every young person in your service. Real-time bands, trend arrows, weekly deltas. Surfaced where you'll actually see them.
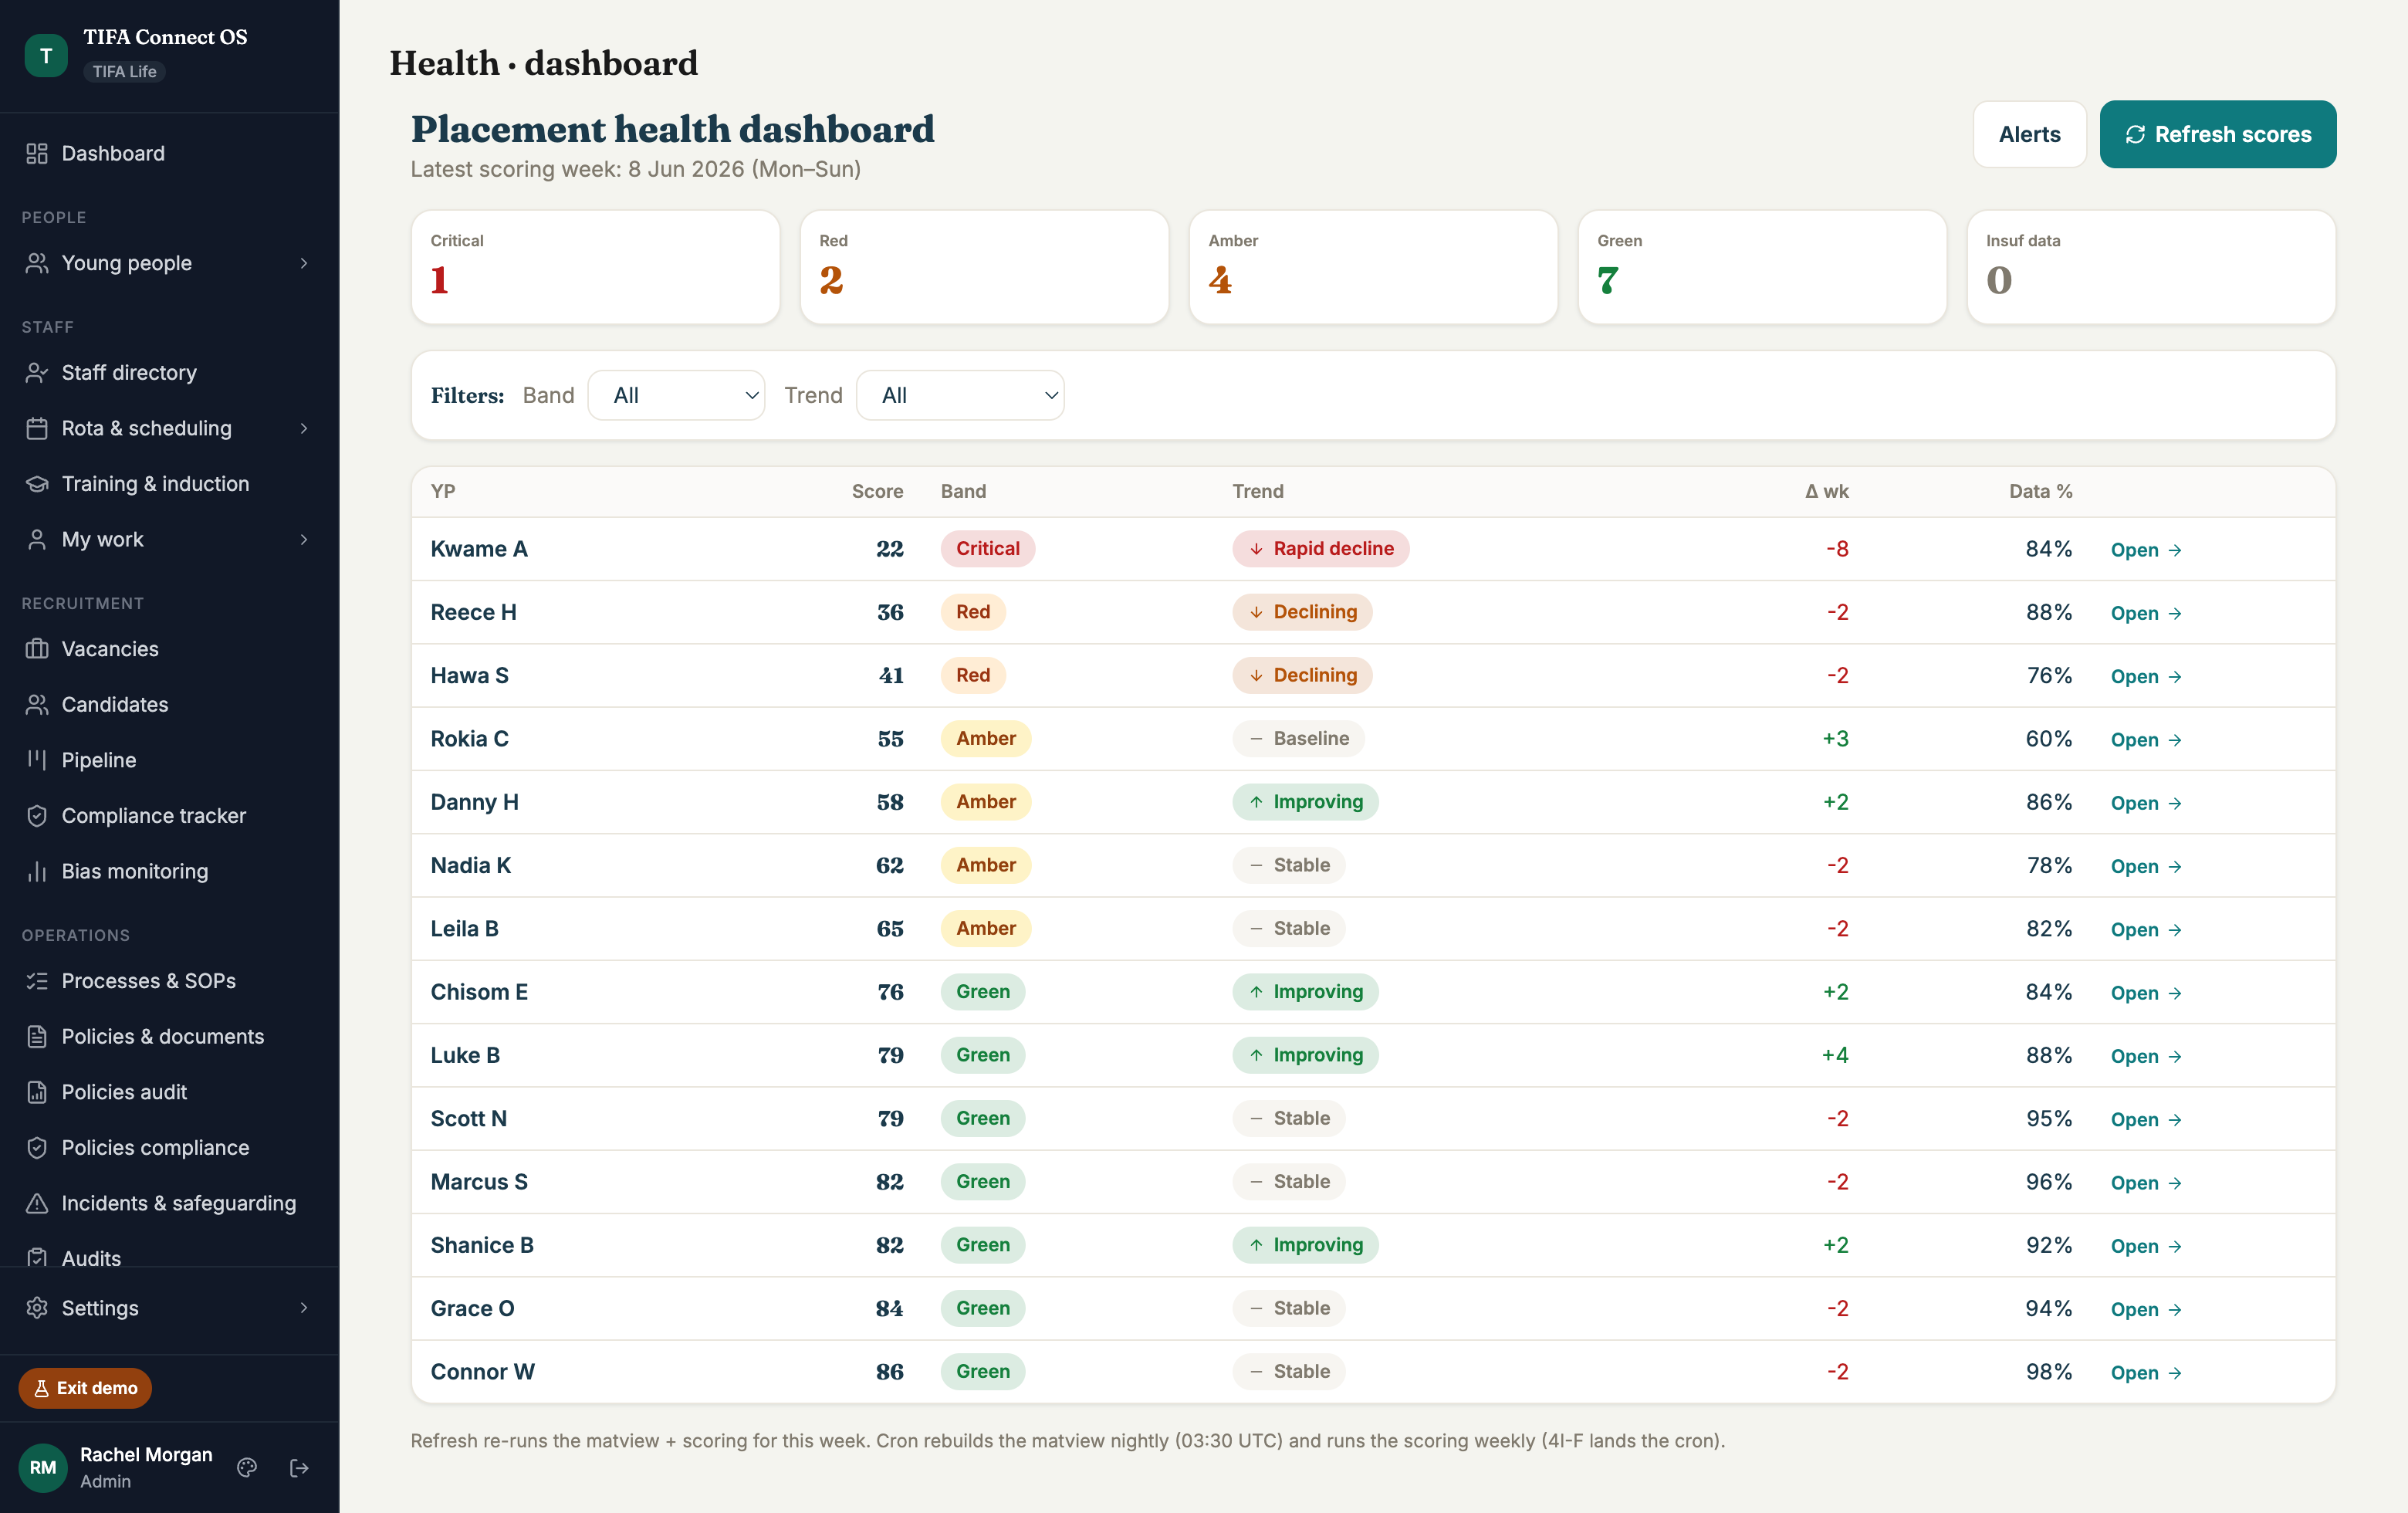
Critical / Red / Amber / Green tiles surface the placements needing attention this week. Sorted by safeguarding weight.
Trend arrows on every score so you know what changed since last review. Not just the absolute number.
Each score carries a confidence band so you know which to act on and which to chase more evidence for.
By the time an incident is logged, it's already too late.
Risk lives in patterns, not in single events
The signs that a placement is in trouble. Missed welfare checks, declining engagement, behavioural shifts, household tension. Show up days or weeks before an incident. Most providers only see them in hindsight, after a serious case review.
Managers can't watch every YP every day
A Service Manager running 3–5 services and 15+ young people physically cannot read every daily log every day. Critical signals get buried in volume. The placement that's quietly drifting goes unnoticed until the call from the LA.
"Everything's fine" until it isn't
Without a structured early-warning system, the only escalation path is the incident itself. By then you're managing a crisis, defending a placement, or. Worst case. Losing one.
A health score for every placement. Updated every day.
TIFA Connect calculates a Placement Health Score for every active young person. Every night, automatically. By looking at the signals already flowing through the system. No extra data entry. No new forms.
Traditional risk assessment is a manager filling in a form every six months. Reactive. Lagging indicator. By the time a risk shows up in a review, the young person has already escalated. Continuous 9-dimension scoring is the opposite. Algorithmic assessment using daily logs, incident patterns, welfare check trends, missing episode frequency, mood scoring, and key working session content. Predictive. Leading indicator. Surfaces destabilisation two to four weeks before traditional reviews catch it.
Signals are weighted, not just counted
Welfare checks, missed engagements, incident frequency, mood markers in daily logs, attendance trends, medication compliance, and key worker observations all feed the score. Different signals carry different weight depending on the YP's risk profile.
Trend matters more than the number
A score of 72 that's been stable for six months is fine. A score of 78 that dropped 14 points in a fortnight is the one you need to look at. The system flags trajectory, not just absolute value.
Manager-reviewed, not algorithm-only
Scores prompt. They don't decide. The manager always sees the underlying signals and confirms or overrides. The system creates the surface area for decisions, your team makes them.
9 dimensions of operational care quality. Weighted, scored, evidenced.
Each placement scored continuously across 9 dimensions of operational care quality. Stability, Engagement, Incidents, Safeguarding, Welfare, Education / Employment / Training, Health & Medication, Support Network, and Contextual factors. Weighted by safeguarding significance. Surfaced with trend lines, key signals, and alert history that tell the story of how a placement is changing over time.
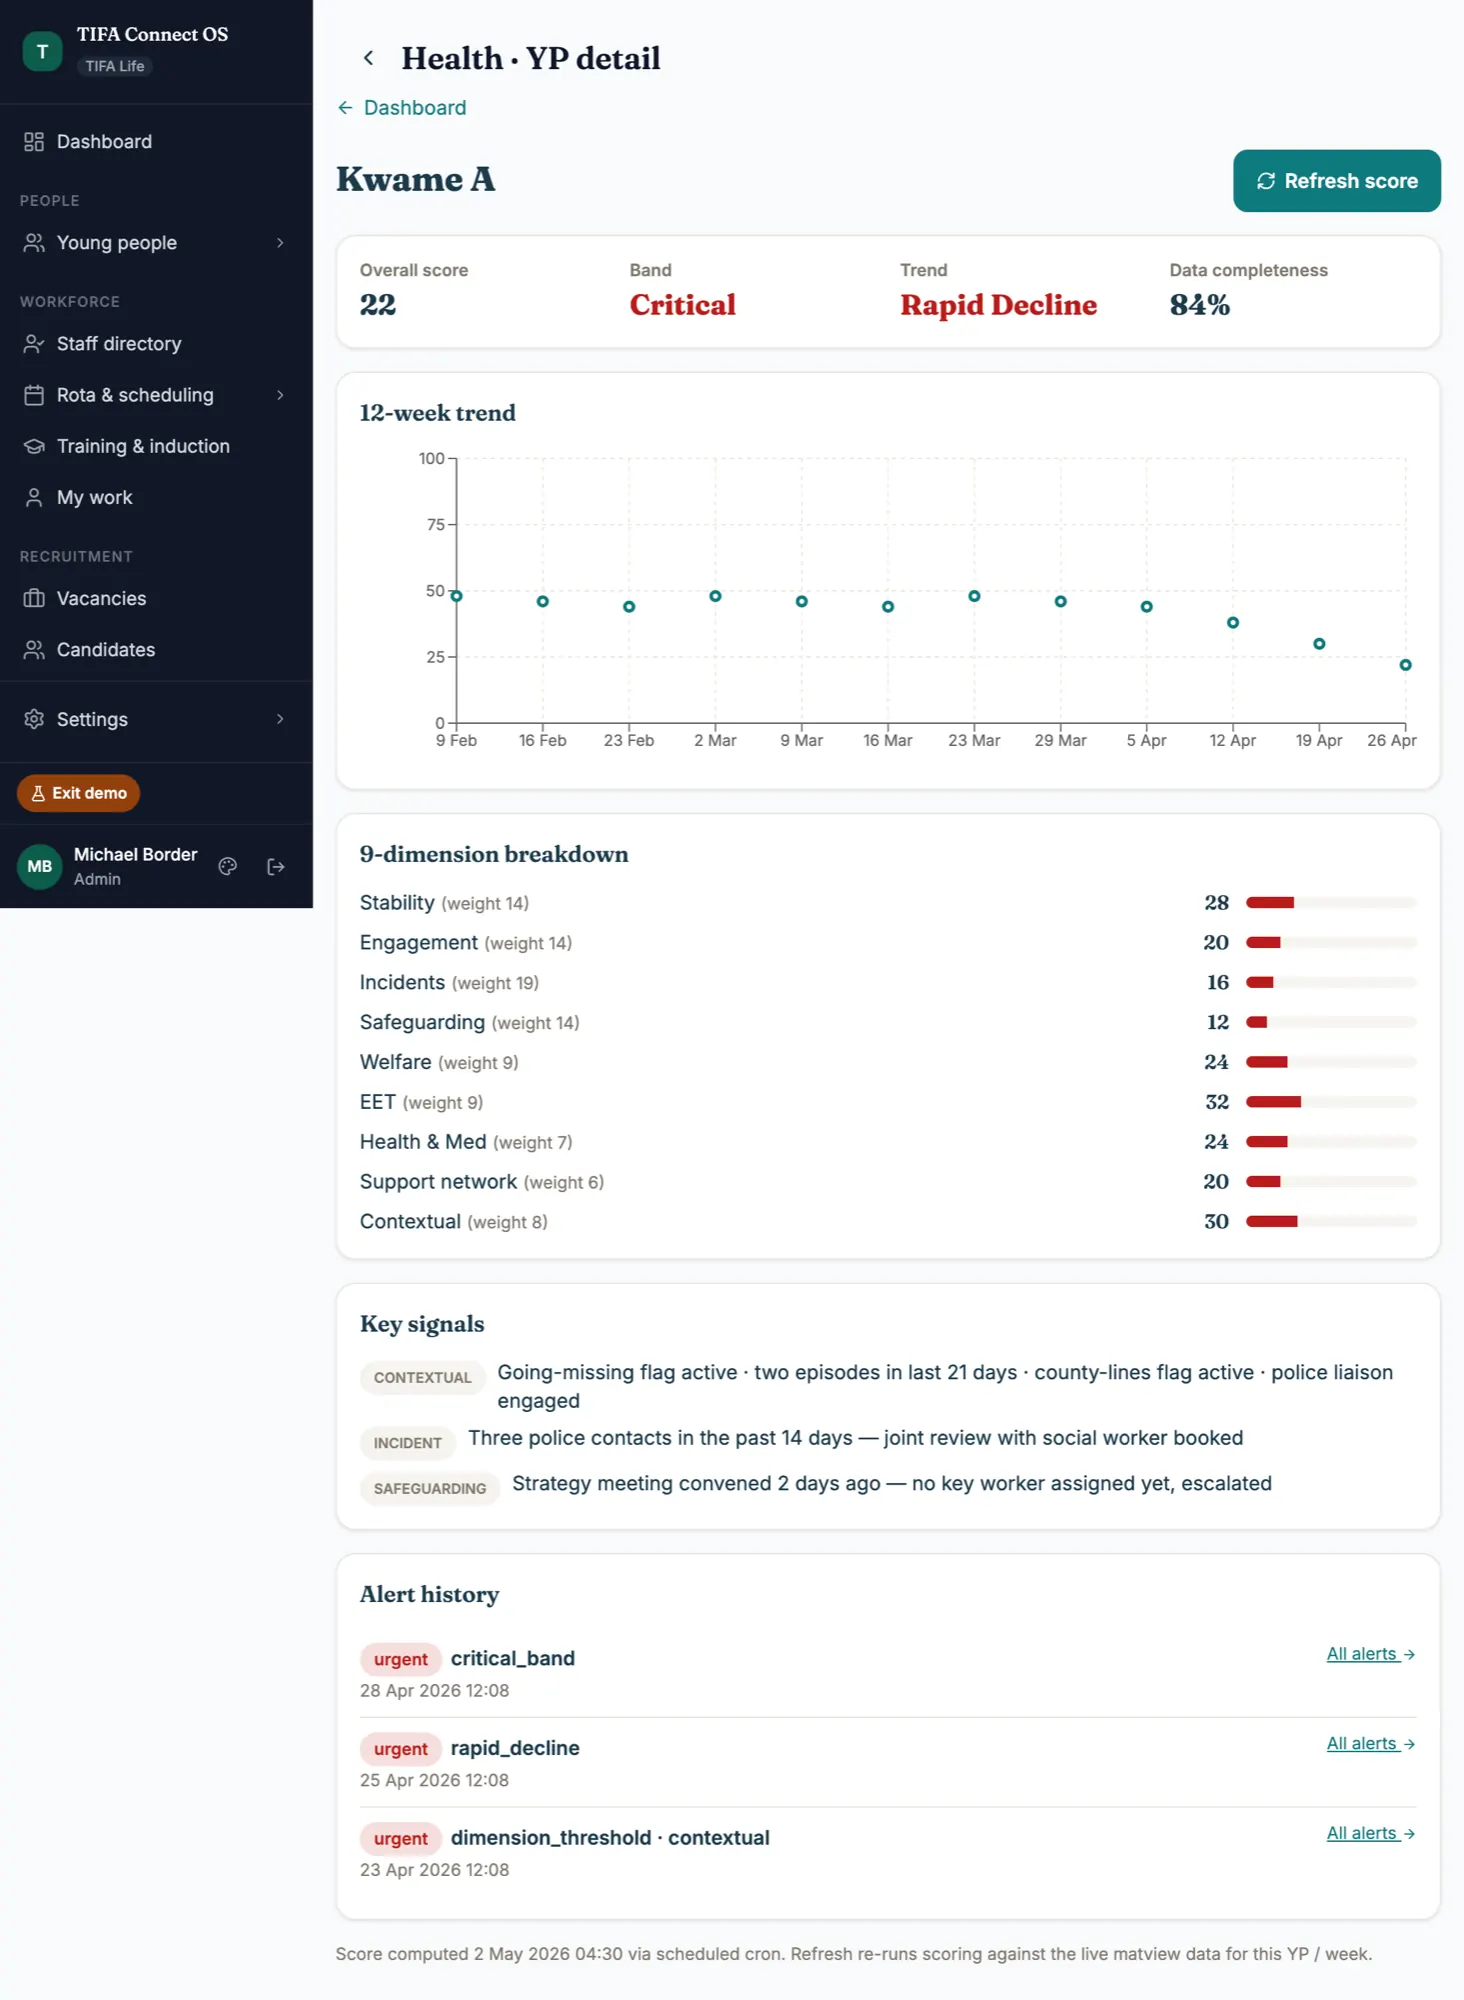
9-dimension scoring with weights mirroring backend org_health_weights. Dimensions, scores, and signals all live data · Click to enlarge.
Stable. Watch. Action.
Every YP sits in one of three bands every morning. Managers open the dashboard, see exactly which placements need attention today, and skip the ones that don't.
Stable
Signals are healthy and trending well. Standard supervision schedule applies. No escalation needed.
Watch
One or more signals are drifting. Manager prompted to review the underlying logs and consider intervention. May resolve naturally or may need a check-in.
Action
Multiple signals deteriorating or one critical signal triggered. Manager required to review and document a response within 24 hours. Tracked through to resolution.
Every signal that already lives in your system.
No additional data entry. The Placement Health Score uses what your team already captures during normal operations.
Each YP scored continuously across nine dimensions: going missing, county lines exposure, child sexual exploitation risk, substance misuse, mental health deterioration, self-harm, suicidal ideation, aggression or violence, vulnerability to exploitation by others. Each scored Low / Medium / High / Very High with a confidence interval. The four signal categories below show how the underlying data feeds those nine risk scores.
Welfare & engagement
- Welfare check completion rate
- Missed appointments and sessions
- Education & employment attendance
- Goal progress vs plan
Behavioural markers
- Mood and presentation patterns in daily logs
- Sleep and routine disruption
- Substance use indicators
- Withdrawal or isolation signals
Risk & safeguarding
- Incident frequency and severity trend
- Missing person episodes
- Risk register changes
- Safeguarding concerns raised
Health & compliance
- Medication administration record gaps
- Health appointment attendance
- Mental health support engagement
- Key worker session frequency
Three layers of insight.
Per-YP score with trend. Every young person has their own score with 30, 90, and 180-day trends, plus comparison against their own baseline so a normally-low-engaging YP isn't flagged for behaviour that's stable for them. The view drills into the underlying nine risk dimensions, lets the manager add context, and links directly to the daily logs and incidents that moved the score this week.
Property cohort health. Aggregates the scores of every YP in a single property, which surfaces cohort dynamics that no individual score can. When two YPs in the same house drift in the same direction in the same week, that's almost always a property-level issue. Staffing instability, a new placement disrupting the mix, a maintenance backlog affecting morale. The cohort score makes these patterns visible weeks before they reach a serious incident.
Service-wide trend. The org-level Placement Health Score average plotted against operational metrics. Agency staff usage, registered manager absences, training completion rates, incident frequency. When the score dips and agency usage spiked the same week, the correlation is there to see. Useful for board reporting, useful for commissioner conversations, useful for spotting the upstream cause of downstream risk.
Predictive vs reactive.
- Continuous algorithmic assessment
- 9 dimensions specific to 16+ supported accommodation
- AI risk narratives with citations
- Intervention tracking closes the loop
What changes when you can see risk before it escalates.
Fewer incidents reach the LA
Catching drift at "Watch" rather than "Action" means most situations are resolved through normal supervision before they require formal escalation. Commissioners see a stable provider, not a reactive one.
Placements stay placed
Placement breakdowns are expensive. For the YP, the LA, and your business. Early intervention preserves placements that would otherwise have been lost. Every retained placement is recurring revenue saved.
Manager attention goes where it's needed
Stop reading every log every day. The system tells you which three placements need your eyes today and which fifteen don't. That's hours of management time reclaimed every week.
Better evidence at inspection
Inspectors see structured early-warning oversight, documented reviews, and tracked interventions. The markers of a well-governed provider. The score itself becomes part of your quality story.
Stop reacting. Start anticipating.
Placement Health Score is included in the Pro tier. Founding partners get a 3-year price lock on first 20 providers.